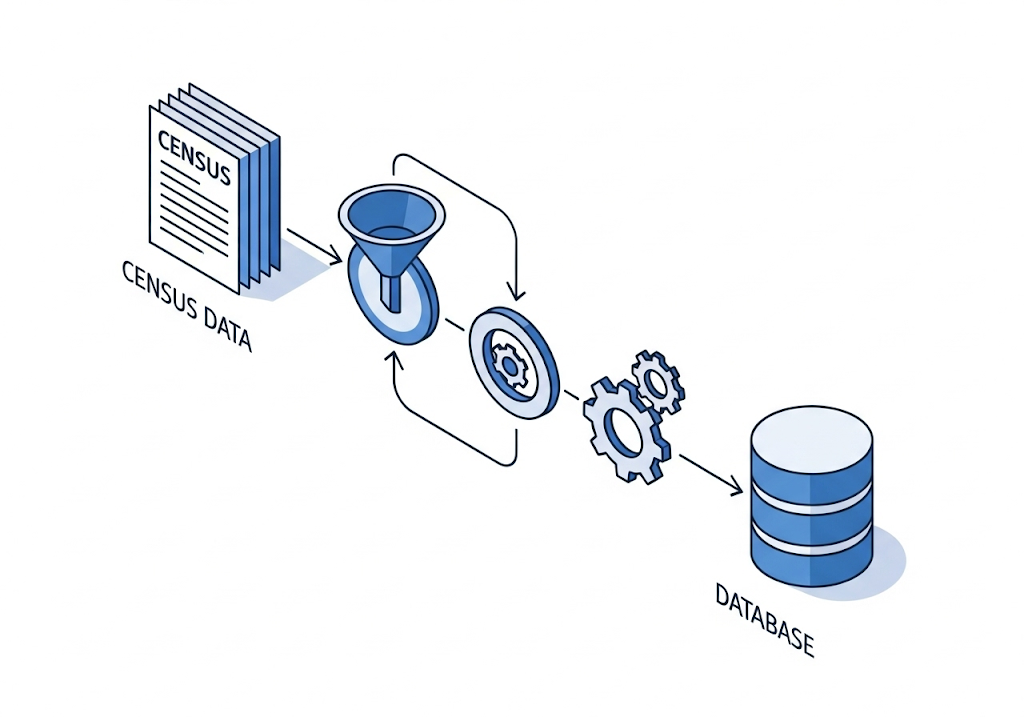
Case Study: Demographics

Beyond Headcounts:
Granular Population Intelligence.

How we moved from static census spreadsheets to dynamic, multi-dimensional vector maps to identify and serve underrepresented communities in football.

Population Density Visualization

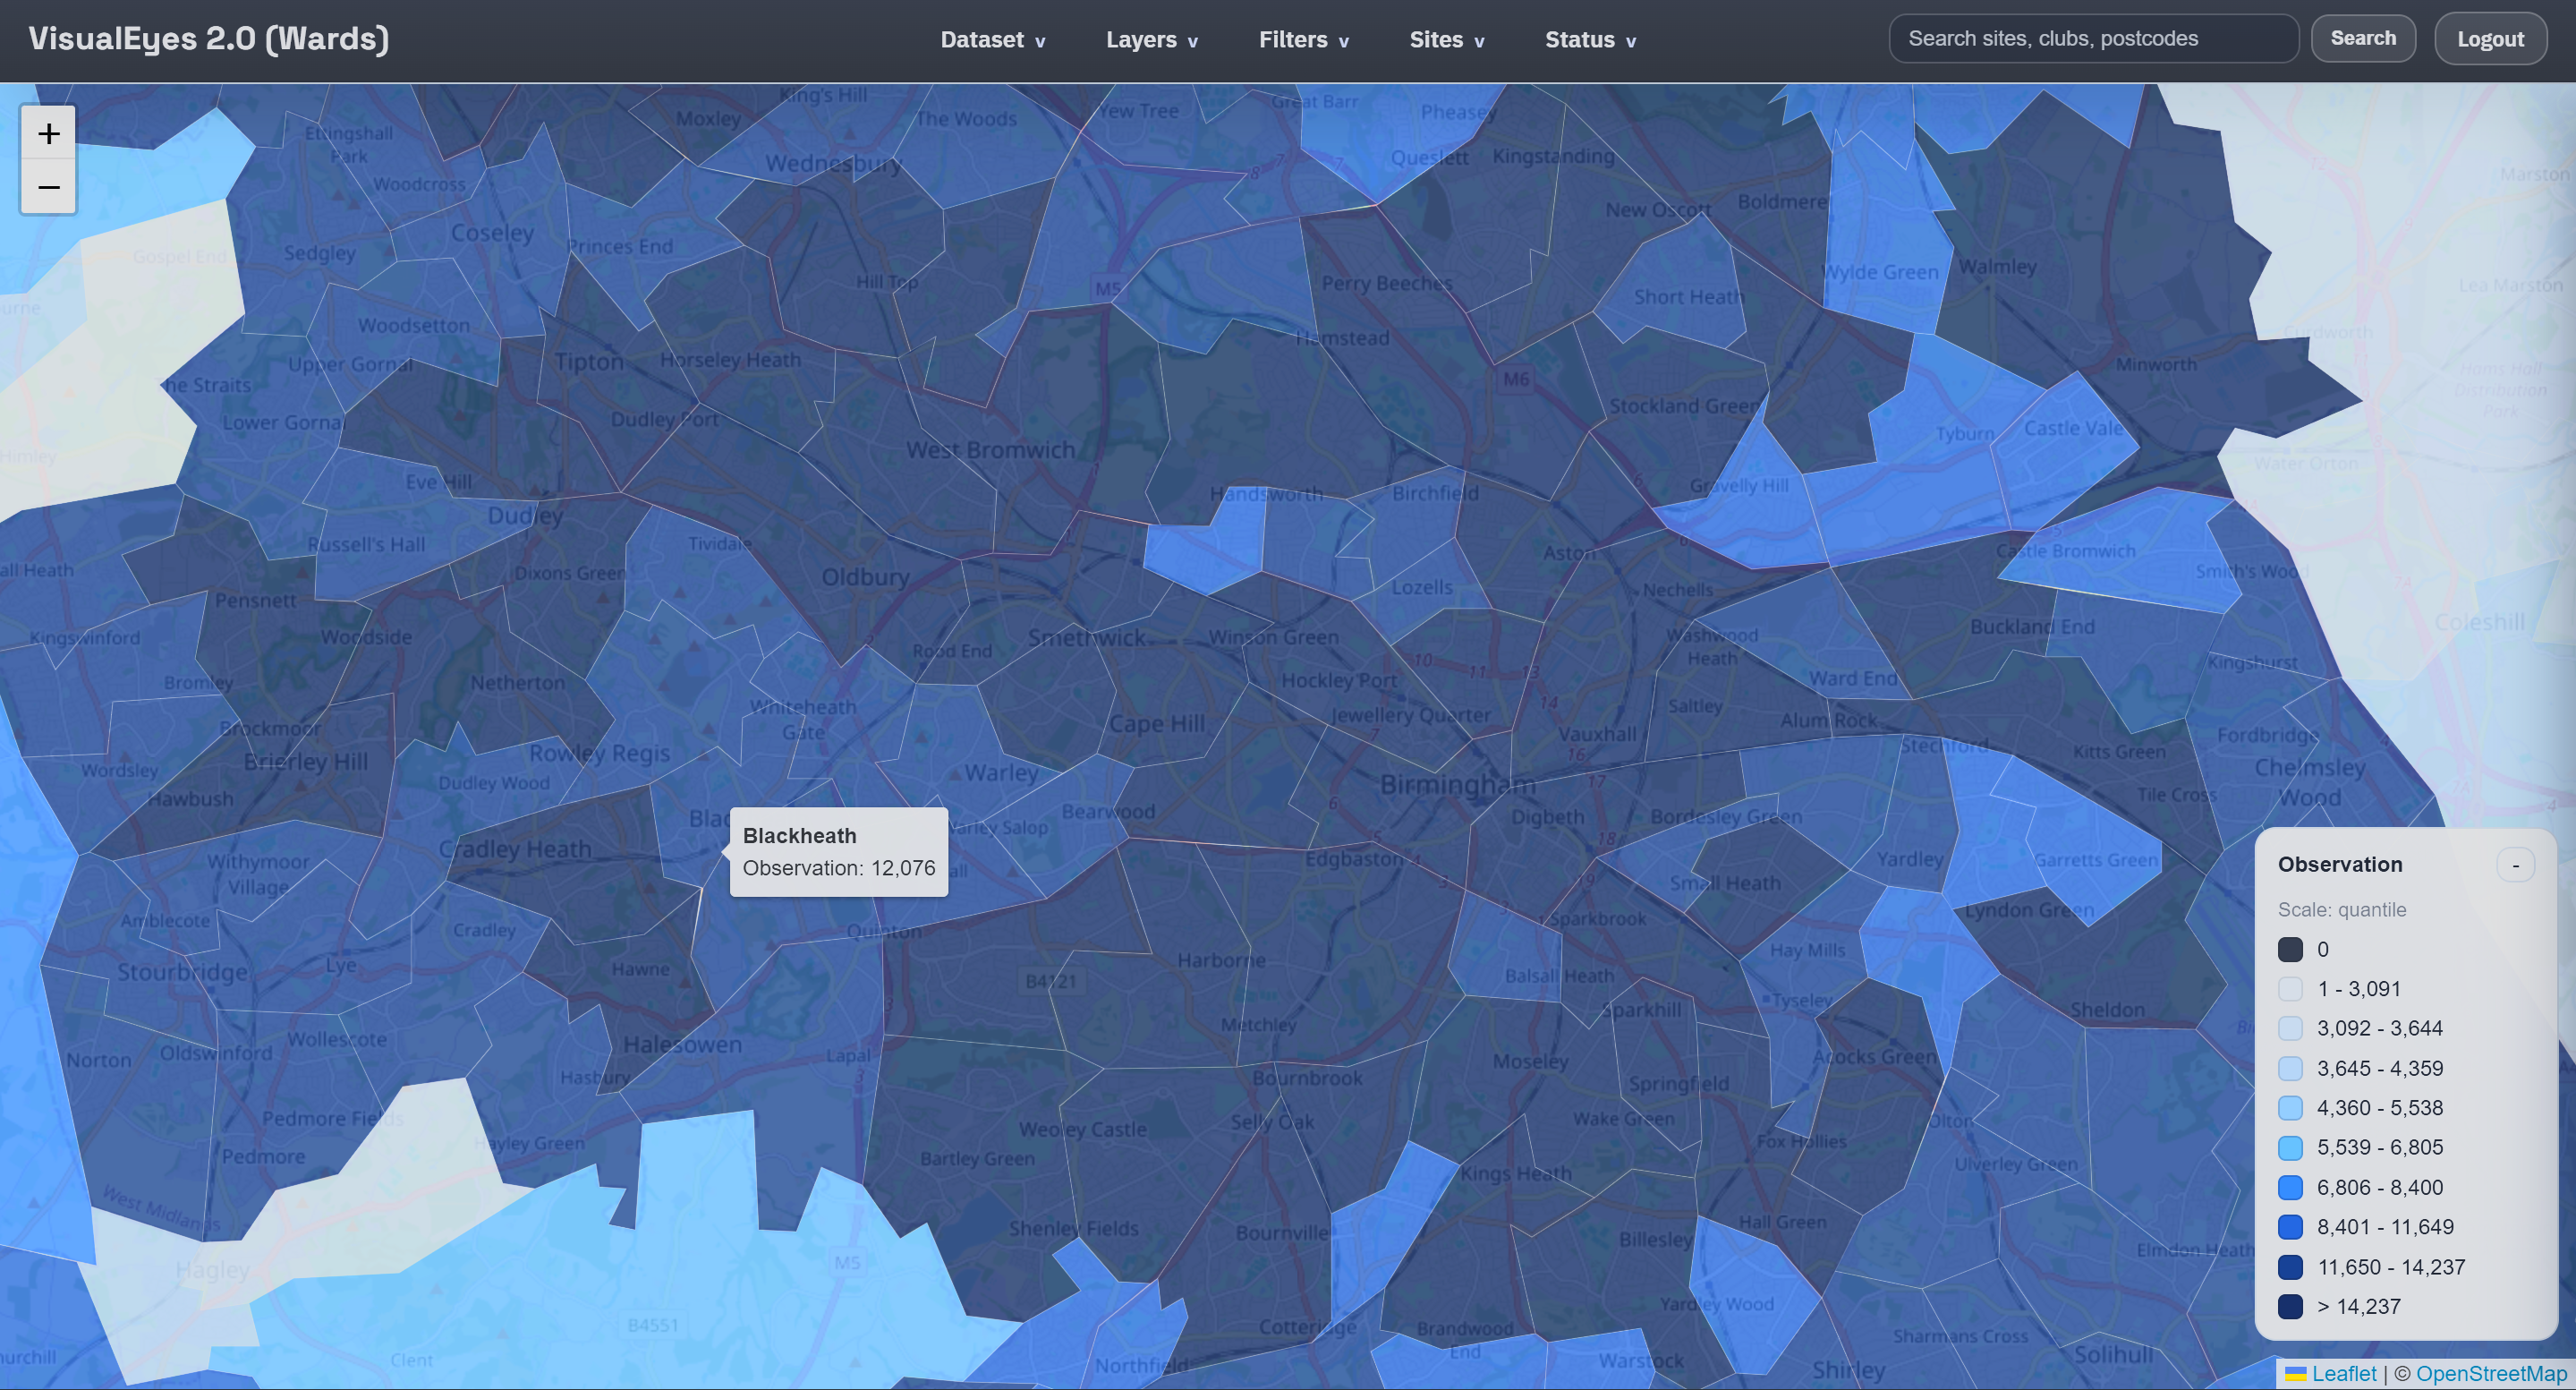
VisualEyes 2.0 Output

Ward-Level Ethnicity & Age Overlay

The Demand

Why simple population counts weren't enough for strategic football development.

Historically, funding decisions were made using broad population averages. A "high population" area was assumed to need more facilities. However, this blunt approach ignored the nuance of participation.

To effectively grow the game, we needed to identify specific demographics:

woman

Gender Parity

Locating high concentrations of girls under 16 for "Wildcats" centers.

diversity_3

Ethnicity

Supporting diverse communities with targeted inclusion programs.

accessible

Disability

Identifying areas with high disability rates to plan accessible sessions.

mosque

Faith

Connecting faith centers with football provisions.

Data Pipeline Diagram
Methodology

Ingesting Census 2021

We moved beyond static spreadsheets by building a robust ETL (Extract, Transform, Load) pipeline using Python Pandas.

  • 1
    Data Normalization

    Raw bulk data from the ONS API was normalized to ensure consistent ward codes across 10+ datasets.

  • 2
    Spatial Joins

    Using PostGIS, we spatially joined demographic data to Ward boundary polygons, creating a queryable vector layer.

  • 3
    Optimization

    Geometry simplification reduced load times, allowing the browser to render thousands of data points instantly.

Evolution of Intelligence

From manual lookups to instant visual insights.

history

Legacy Approach

  • close Static PDF maps or Excel sheets.
  • close Broad averages (e.g., "City-wide data").
  • close Manual cross-referencing with facility lists.
  • close Zero capability for intersectional analysis.
visibility

VisualEyes 2.0

  • check Dynamic Vector Tiles: Interactive, zoomable maps.
  • check Extensive Filtering: "Show me Wards with >20% South Asian population AND <5 pitches."
  • check Intersectional Views: Combining Age + Disability + Index of Multiple Deprivation (IMD).
  • check One-Click Export: Instant evidence generation for grants.

The Result

VisualEyes 2.0 has transformed the strategic planning process. By visualizing the invisible—the specific needs of local communities—we have successfully argued for targeted funding in areas previously overlooked by standard metrics.

100%
Wards Mapped
10+
Data Layers Combined
Community Impact